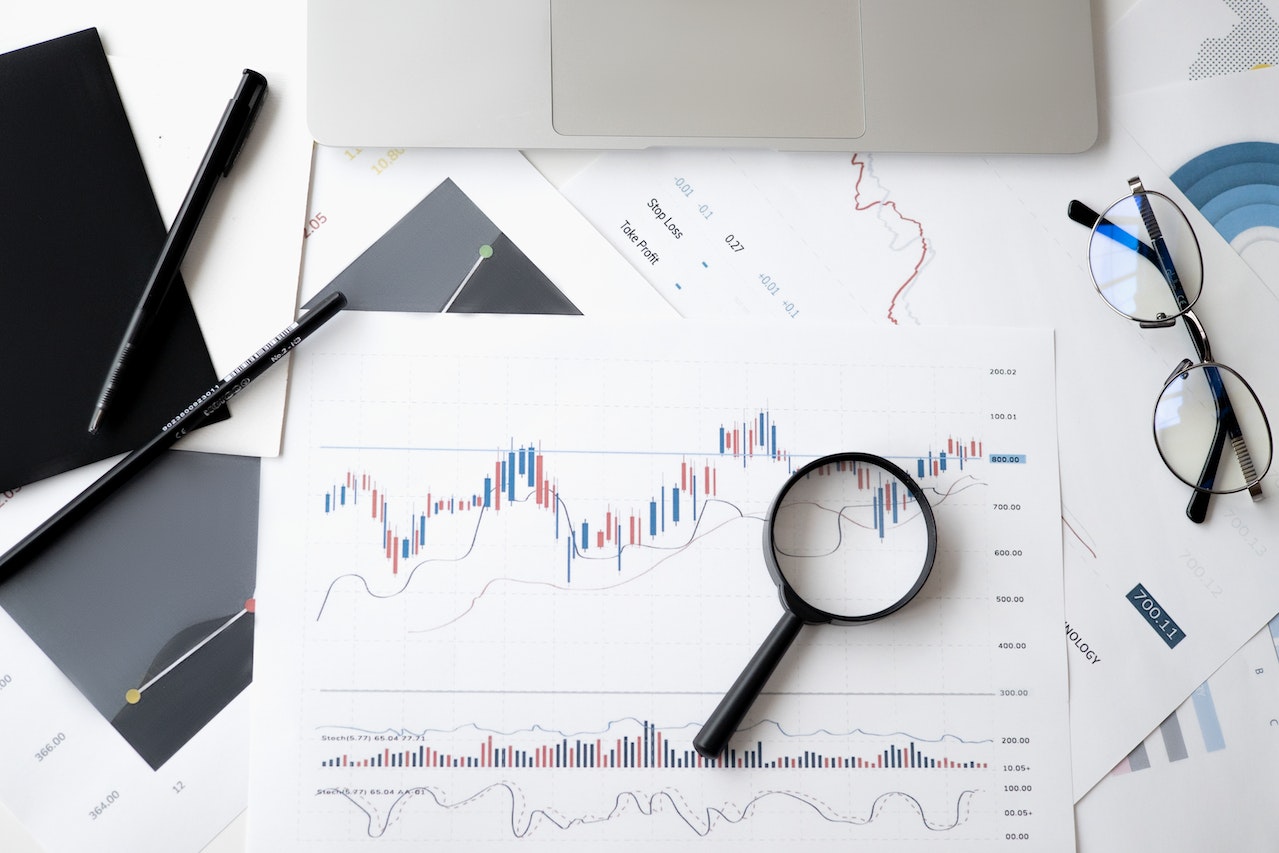
Technical analysis is a trading discipline employed to evaluate investments and identify opportunities by analyzing statistical trends gathered from trading activity, such as price movement and volume. The goal of technical analysis is to forecast future prices and determine the intrinsic value of an investment by studying past market data. Many traders use technical analysis in conjunction with other forms of analysis, such as fundamental analysis, to make informed investment decisions. In this article, we will answer some common questions about technical analysis and provide some useful tips for beginners!
What is Technical Analysis?
Technical analysis is the study of past market data to identify patterns and trends that can be used to forecast future market behavior. Technical analysts believe that all relevant information is reflected in price movements, and they use this information to identify opportunities and make investment decisions.
How Does Technical Analysis Work?
Technical analysis works by analyzing statistical trends gathered from trading activity, such as price movement and volume. Technical analysts use this information to identify patterns that can be used to make predictions about future market behavior.
Always ask questions
When it comes to technical analysis, there is no shortage of opinions and strategies. It can be overwhelming for a beginner trader trying to figure out where to start. The best way to approach learning technical analysis is to always ask questions. There are no stupid questions, so never be afraid to ask for clarification or more information on a particular topic. There are many resources available online and offline that can help you learn about technical analysis, so take advantage of them!
Start with the basics
If you’re new to technical analysis, it’s important to start with the basics and gradually build up your knowledge over time. Learning all the different indicators and chart patterns can be daunting, but if you focus on one thing at a time it will be much easier to digest. A good place to start is with trendlines and support/resistance levels. These concepts are relatively easy to understand and can be used to generate trading signals on their own or in conjunction with other technical indicators.
Don’t get too complicated
One of the biggest mistakes traders make is over-complicating their analysis. Just because there are a million different indicators out there doesn’t mean you need to use all of them! In fact, using too many indicators can actually lead to confusion and bad decision-making. When starting out, stick to a few simple indicators that you are comfortable with and gradually add more as your knowledge and experience grow.
Technical analysis is a great tool that can be used by traders of all experience levels to improve their investment decisions. By starting with the basics and gradually adding more complexity, you can develop a technical analysis strategy that works for you. And always remember to ask questions if you’re ever unsure about something!

